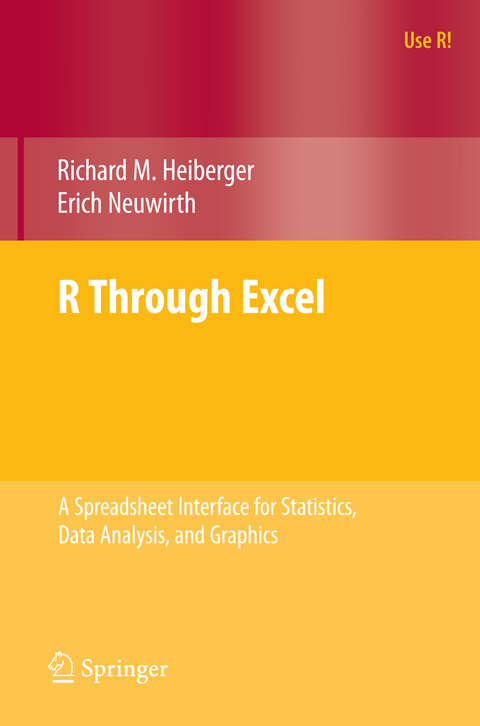
R Through Excel
A Spreadsheet Interface for Statistics, Data Analysis, and Graphics
Seiten
2009
Springer-Verlag New York Inc.
978-1-4419-0051-7 (ISBN)
Springer-Verlag New York Inc.
978-1-4419-0051-7 (ISBN)
RExcel seamlessly integrates the entire set of R's statistical and graphical methods into Excel, allowing students to focus on statistical methods and concepts and minimizing the distraction of learning a new programming language.Data can be transferred between R and Excel “the Excel way” by selecting worksheet ranges and using Excel menus.
R, a free and open source program, is one of the most powerful and the fastest-growing statistics program. Microsoft Excel is the most widely used spreadsheet program, but many statisticians consider its statistical tools too limited.
In this book, the authors build on RExcel, a free add-in for Excel that can be downloaded from the R distribution network. RExcel seamlessly integrates the entire set of R's statistical and graphical methods into Excel, allowing students to focus on statistical methods and concepts and minimizing the distraction of learning a new programming language.
Data can be transferred between R and Excel “the Excel way” by selecting worksheet ranges and using Excel menus. R’s basic statistical functions and selected advanced methods are available from an Excel menu. Results of the computations and statistical graphics can be returned back into Excel worksheet ranges. RExcel allows the use of Excel scroll bars and check boxes to create and animate R graphics as an interactive analysis tool.
The book is designed as a computational supplement to introductory statistics texts and the authors provide RExcel examples covering the topics of the introductory course.
Getting Started.- Using RExcel and R Commander.- Getting Data into R.- Normal and Distributions.- Normal and Workbook.- -Tests.- One-Way ANOVA.- Simple Linear Regression.- What Is Least Squares?.- Multiple Regression#x2014;Two -Variables.- Polynomial Regression.- Multiple Regression#x2014;Three or More -Variables.- Contingency Tables and the Chi-Square Test.
| Erscheint lt. Verlag | 5.8.2009 |
|---|---|
| Reihe/Serie | Use R! |
| Zusatzinfo | 300 Illustrations, color; XXIV, 344 p. 300 illus. in color. |
| Verlagsort | New York, NY |
| Sprache | englisch |
| Maße | 155 x 235 mm |
| Themenwelt | Informatik ► Office Programme ► Excel |
| Mathematik / Informatik ► Mathematik ► Computerprogramme / Computeralgebra | |
| Mathematik / Informatik ► Mathematik ► Wahrscheinlichkeit / Kombinatorik | |
| ISBN-10 | 1-4419-0051-9 / 1441900519 |
| ISBN-13 | 978-1-4419-0051-7 / 9781441900517 |
| Zustand | Neuware |
| Haben Sie eine Frage zum Produkt? |
Mehr entdecken
aus dem Bereich
aus dem Bereich
Datenanalyse und Reporting mit Power Query, Power Pivot und Power BI …
Buch (2023)
Carl Hanser (Verlag)
44,99 €
Komplett in Farbe. Ideal für alle Einsteiger, Umsteiger und auch …
Buch | Softcover (2022)
Markt + Technik Verlag
12,95 €


